Table 2. General characteristics of the obese rat model. Mean ± SEM ** p<0.001; ***p<0.0001 compared with the age-matched control group; n=17-22 for each group. HOMA IR: homeostatic model assessment of insulin resistant
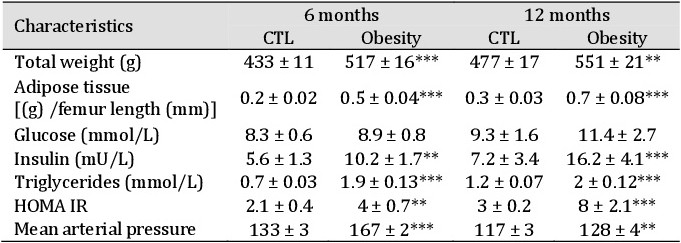
Table 2. General characteristics of the obese rat model. Mean ± SEM ** p<0.001; ***p<0.0001 compared with the age-matched control group; n=17-22 for each group. HOMA IR: homeostatic model assessment of insulin resistant